Homeowners Contractors Arizona · every row checked at the source
Find a pro

Data

Arizona Average Temperature and Monsoon Rain by County

La Paz County runs hottest at the Parker station, with a July normal high of 108.4 F.[6] Coconino County runs coolest, at 82.0 F at Flagstaff Pulliam Airport.[3] That is a 26-degree gap inside one state, which is why a single "Arizona average temperature" describes almost no one's weather. The table on this page sets all 15 counties side by side, using NOAA 1991-2020 normals.

Updated Oct 22, 2026

Heat and monsoon

15 counties NOAA NCEI 1991–2020 normalsOne station per county, our choiceGrouped by National Weather Service office

The station for each county is our choice: the longest record near the county seat. The rain figure is July through September, the sum of the NCEI 1991–2020 monthly normals. A county with no station reads "No NOAA normals station". Open a row for the county month by month.

Heat and monsoon normals by Arizona county, NOAA 1991-2020
CountyJuly normal highDays ≥ 100°FJul–Sep rainStation (our choice)
NWS PhoenixThe forecast office that covers these counties
96.8°F31.25.8 inGlobe #3

Gila County, month by month

Normal high, °FRain, in. (scale shared by every county)
Gila County monthly normals
MonthJanFebMarAprMayJunJulAugSepOctNovDec
High °F55.359.467.776.185.296.596.895.390.179.265.255.9
Low °F32.936.340.947.454.764.570.668.963.151.84132.7
Rain in.2.051.91.040.440.350.262.712.081.011.221.051.51
Station
Globe #3 · USC00023501Our choice of station: 0 miles from Globe, within 10 miles of the county seat; longest active temperature record in that range (GHCN-Daily TMAX 2009-2026, 18 years).
Source
NOAA NCEI 1991–2020 normals · checked Oct 21, 2026
108.4°F126.31.02 inParker

La Paz County, month by month

Normal high, °FRain, in. (scale shared by every county)
La Paz County monthly normals
MonthJanFebMarAprMayJunJulAugSepOctNovDec
High °F68.772.779.986.595.5105.3108.4107.6103.190.377.666.7
Low °F41.54549.956.464.473.780.781.273.860.949.240.4
Rain in.0.850.730.550.160.070.030.180.430.410.420.230.51
Station
Parker · USC00026250Our choice of station: 0 miles from Parker, within 10 miles of the county seat; longest active temperature record in that range (GHCN-Daily TMAX 1893-2024, 132 years).
Source
NOAA NCEI 1991–2020 normals · checked Oct 21, 2026
106.5°F111.32.41 inPhoenix Sky Harbor Intl. Airport

Maricopa County, month by month

Normal high, °FRain, in. (scale shared by every county)
Maricopa County monthly normals
MonthJanFebMarAprMayJunJulAugSepOctNovDec
High °F67.670.878.185.594.5104.2106.5105.1100.489.276.566.2
Low °F464954.560.869.578.684.583.678.165.653.745.3
Rain in.0.870.870.830.220.130.020.910.930.570.560.570.74
Station
Phoenix Sky Harbor Intl. Airport · USW00023183Our choice of station: 4 miles from Phoenix, within 10 miles of the county seat; longest active temperature record in that range (GHCN-Daily TMAX 1933-2026, 94 years).
Source
NOAA NCEI 1991–2020 normals · checked Oct 21, 2026
106.6°F115.63.06 inCasa Grande NM

Pinal County, month by month

Normal high, °FRain, in. (scale shared by every county)
Pinal County monthly normals
MonthJanFebMarAprMayJunJulAugSepOctNovDec
High °F67.671.378.286.495.2105.1106.6104.9100.790.577.866.9
Low °F3739.745.250.859.26877.176.669.856.343.736.3
Rain in.0.981.020.940.250.20.061.121.240.70.480.490.77
Station
Casa Grande NM · USC00021314Our choice of station: 9 miles from Florence, within 10 miles of the county seat; longest active temperature record in that range (GHCN-Daily TMAX 1908-2026, 119 years).
Source
NOAA NCEI 1991–2020 normals · checked Oct 21, 2026
106.7°F118.21.12 inYuma MCAS

Yuma County, month by month

Normal high, °FRain, in. (scale shared by every county)
Yuma County monthly normals
MonthJanFebMarAprMayJunJulAugSepOctNovDec
High °F69.873.480.286.494.3103.3106.7106.4101.490.277.767.8
Low °F47.950.45559.866.97582.683.277.665.754.446.8
Rain in.0.390.380.390.140.060.010.240.20.680.130.230.43
Station
Yuma MCAS · USW00003145Our choice of station: 5 miles from Yuma, within 10 miles of the county seat; longest active temperature record in that range (GHCN-Daily TMAX 1982-2026, 45 years).
Source
NOAA NCEI 1991–2020 normals · checked Oct 21, 2026
NWS TucsonThe forecast office that covers these counties
87.4°F0.310.04 inBisbee 1WNW

Cochise County, month by month

Normal high, °FRain, in. (scale shared by every county)
Cochise County monthly normals
MonthJanFebMarAprMayJunJulAugSepOctNovDec
High °F55.859.766.973.480.989.387.484.881.674.96456.2
Low °F32.234.738.24451.260.163.261.156.547.738.832.6
Rain in.1.311.140.880.190.280.483.814.251.980.980.741.07
Station
Bisbee 1WNW · USC00020775Our choice of station: 0 miles from Bisbee, within 10 miles of the county seat; longest active temperature record in that range (GHCN-Daily TMAX 1985-2021, 37 years).
Source
NOAA NCEI 1991–2020 normals · checked Oct 21, 2026
99°F45.64.27 inSafford Ag. Center

Graham County, month by month

Normal high, °FRain, in. (scale shared by every county)
Graham County monthly normals
MonthJanFebMarAprMayJunJulAugSepOctNovDec
High °F6266.874.382.591.41009996.993.284.471.761.1
Low °F30.333.939.345.553.662.669.4686148.337.430.2
Rain in.0.710.660.450.210.180.271.351.841.080.750.510.77
Station
Safford Ag. Center · USC00027390Our choice of station: 2 miles from Safford, within 10 miles of the county seat; longest active temperature record in that range (GHCN-Daily TMAX 1948-2026, 79 years).
Source
NOAA NCEI 1991–2020 normals · checked Oct 21, 2026
97.5°F40.25.07 inDuncan

Greenlee County, month by month

Normal high, °FRain, in. (scale shared by every county)
Greenlee County monthly normals
MonthJanFebMarAprMayJunJulAugSepOctNovDec
High °F60.264.972.580.588.998.197.595.590.781.469.359.2
Low °F25.128.533.138.647.157.265.564.656.442.830.824.9
Rain in.0.940.840.50.170.290.251.682.181.210.710.641
Station
Duncan · USC00022754Our choice of station: 23 miles from Clifton, no active normals station within 10 miles of the county seat, so searched within 40 miles; longest active temperature record in that range (GHCN-Daily TMAX 1901-2026, 126 years).
Source
NOAA NCEI 1991–2020 normals · checked Oct 21, 2026
100.2°F67.95.51 inTucson Intl. Airport

Pima County, month by month

Normal high, °FRain, in. (scale shared by every county)
Pima County monthly normals
MonthJanFebMarAprMayJunJulAugSepOctNovDec
High °F66.569.275.882.991.8101.2100.298.695.186.375.165.5
Low °F40.843.24853.361.871.176.375.270.45947.940.5
Rain in.0.840.840.560.240.20.232.211.981.320.670.560.96
Station
Tucson Intl. Airport · USW00023160Our choice of station: 6 miles from Tucson, within 10 miles of the county seat; longest active temperature record in that range (GHCN-Daily TMAX 1946-2026, 81 years).
Source
NOAA NCEI 1991–2020 normals · checked Oct 21, 2026
94.4°F22.39.73 inNogales 6 N

Santa Cruz County, month by month

Normal high, °FRain, in. (scale shared by every county)
Santa Cruz County monthly normals
MonthJanFebMarAprMayJunJulAugSepOctNovDec
High °F65.367.272.879.487.496.594.492.390.583.573.464.6
Low °F28.330.53539.546.356.365.36457.544.634.428
Rain in.0.980.920.690.350.170.683.593.912.230.850.591.14
Station
Nogales 6 N · USC00025924Our choice of station: 8 miles from Nogales, within 10 miles of the county seat; longest active temperature record in that range (GHCN-Daily TMAX 1952-2026, 75 years).
Source
NOAA NCEI 1991–2020 normals · checked Oct 21, 2026
NWS FlagstaffThe forecast office that covers these counties
91.1°F1.25.02 inSaint Johns

Apache County, month by month

Normal high, °FRain, in. (scale shared by every county)
Apache County monthly normals
MonthJanFebMarAprMayJunJulAugSepOctNovDec
High °F49.655.863.670.879.89091.18883.172.56049.3
Low °F20.623.928.935.34452.459.557.650.538.227.419.8
Rain in.0.580.560.280.270.390.191.941.951.130.860.550.66
Station
Saint Johns · USC00027435Our choice of station: 3 miles from St. Johns, within 10 miles of the county seat; longest active temperature record in that range (GHCN-Daily TMAX 1901-2026, 126 years).
Source
NOAA NCEI 1991–2020 normals · checked Oct 21, 2026
82°F07.49 inFlagstaff Pulliam Airport

Coconino County, month by month

Normal high, °FRain, in. (scale shared by every county)
Coconino County monthly normals
MonthJanFebMarAprMayJunJulAugSepOctNovDec
High °F43.445.752.259.268.179.18279.374.163.652.143
Low °F17.619.623.828.234.642.551.450.642.531.52316.9
Rain in.2.052.171.880.890.770.32.613.041.841.521.551.9
Station
Flagstaff Pulliam Airport · USW00003103Our choice of station: 4 miles from Flagstaff, within 10 miles of the county seat; longest active temperature record in that range (GHCN-Daily TMAX 1893-2026, 134 years).
Source
NOAA NCEI 1991–2020 normals · checked Oct 21, 2026
94.6°F12.32.92 inWinslow Muni. Airport

Navajo County, month by month

Normal high, °FRain, in. (scale shared by every county)
Navajo County monthly normals
MonthJanFebMarAprMayJunJulAugSepOctNovDec
High °F49.856.264.571.981.292.394.691.785.673.860.348.7
Low °F2225.931.837.946.255.263.762.553.840.428.921.7
Rain in.0.510.420.490.250.30.140.891.160.870.510.480.5
Station
Winslow Muni. Airport · USW00023194Our choice of station: 34 miles from Holbrook, no active normals station within 10 miles of the county seat, so searched within 40 miles; longest active temperature record in that range (GHCN-Daily TMAX 1898-2026, 129 years).
Source
NOAA NCEI 1991–2020 normals · checked Oct 21, 2026
89.6°F1.27.11 inPrescott

Yavapai County, month by month

Normal high, °FRain, in. (scale shared by every county)
Yavapai County monthly normals
MonthJanFebMarAprMayJunJulAugSepOctNovDec
High °F52.655.261.267.876.38789.687.282.472.961.651.9
Low °F23.826.431.637.34553.66159.752.240.129.823.6
Rain in.1.521.781.460.570.510.232.692.781.640.960.871.45
Station
Prescott · USC00026796Our choice of station: 3 miles from Prescott, within 10 miles of the county seat; longest active temperature record in that range (GHCN-Daily TMAX 1898-2026, 129 years).
Source
NOAA NCEI 1991–2020 normals · checked Oct 21, 2026
NWS Las VegasThe forecast office that covers these counties
98.7°F32.42.7 inKingman Mohave Co. Airport

Mohave County, month by month

Normal high, °FRain, in. (scale shared by every county)
Mohave County monthly normals
MonthJanFebMarAprMayJunJulAugSepOctNovDec
High °F57.460.667.474.884.995.198.797.290.978.966.155.7
Low °F30.933.338.143.452.762.37068.960.448.336.530.2
Rain in.0.981.040.590.460.080.110.860.880.960.740.620.68
Station
Kingman Mohave Co. Airport · USW00093167Our choice of station: 8 miles from Kingman, within 10 miles of the county seat; longest active temperature record in that range (GHCN-Daily TMAX 1996-2026, 31 years).
Source
NOAA NCEI 1991–2020 normals · checked Oct 21, 2026

Every month, every county: climate by month

Which Arizona counties run hottest

The low-desert counties lead on every heat measure. Yuma County's station records 118.2 days a year at or above 100 F and a July high of 106.7 F.[15][14] Pinal County's station logs 115.6 days and 106.6 F,[12][11] and the station for Maricopa County (Phoenix Sky Harbor) shows 111.3 days and 106.5 F.[9][8]
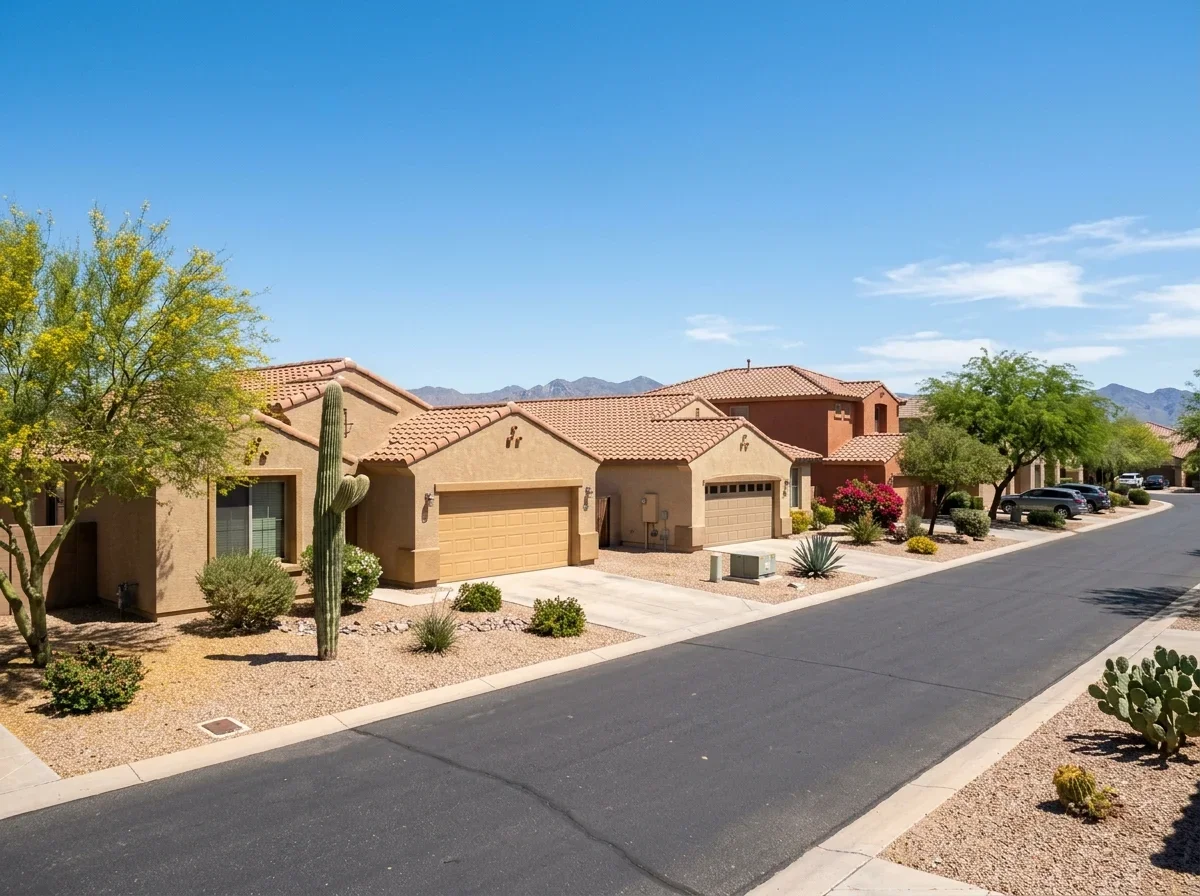
Desert neighborhood homes under a clear sunny sky
Low-desert homes under a clear summer sky

La Paz County's Parker station tops them all at 126.3 days.[7]

County stationDays at or above 100 FJuly high
Yuma118.2106.7 F
Pinal115.6106.6 F
Maricopa (Phoenix Sky Harbor)111.3106.5 F
Cochise (Bisbee)0.387.4 F
Coconino0.0Not listed

The cool end is the high country. Coconino County's station has 0.0 days at or above 100 F.[4] Cochise County's Bisbee station has 0.3 days and a July high of 87.4 F.[2][1]

Normals are not records. They describe a typical summer, not the hottest day on file.

For a month-by-month view, see the Phoenix and Arizona temperature by month page.

How we picked each county's weather station

Each row uses one NOAA station near the county seat, or the nearest active normals station within the distance stated in that row. Most stations sit within 10 miles of the seat. Two counties do not: the Greenlee County row uses Duncan, 23 miles from Clifton,[5] and the Navajo County row uses Winslow Municipal Airport, 34 miles from Holbrook.[10]

A county average would blend desert floor and mountain stations into a number that describes no place anyone lives.

Read each figure as the weather at that station, not the whole county. Homes at a different elevation in the same county can run noticeably hotter or cooler.

What the monsoon column measures

The monsoon column adds the July, August and September rain normals at each station. NOAA's normals are monthly, so they cannot be cut to the official season of June 15 through September 30.[21] The column therefore misses June 15 to 30 and includes all of September.

Rain varies sharply by county.

Cochise County's station gets 10.04 inches and Santa Cruz County's gets 9.73 inches.[1][13] La Paz County's gets 1.02 inches and Yuma County's 1.12 inches.[6][14]

Depth

July to September rain normals

Ground level

  • 1.02 inchesLa Paz
  • 1.12 inchesYuma
  • 9.73 inchesSanta Cruz
  • 10.04 inchesCochise

NWS Phoenix notes that the monsoon share of annual rain ranges from under 20% in extreme western Arizona to nearly 70% in eastern mountain areas.[22] A normal also says nothing about where one storm lands.

For prep steps, read monsoon season dates and home prep.

Why the table has no 110-degree count

NOAA's normals publish days at or above 100 F, but no 110 F day count, so the table has none.

The 100 F count is the heat measure available for all 15 counties.

The National Weather Service does publish 110 F counts for a few cities, including Phoenix. Those figures are not part of the county normals used here, so they are not mixed in.

Where to find live heat and storm warnings

Four National Weather Service offices cover Arizona counties:

Flagstaff and Las Vegas have no heat or dust pages of their own, so use the national extreme heat safety[16] and wind and dust storm safety[17] pages.

For what dust storms do to a house, see haboobs and your home. If the heat is straining your cooling system, the HVAC guide covers permits and licensing.

Quick answers

Why does the table have no 110 F count?

NOAA's normals publish days at or above 100 F but no 110 F day count.

Does the monsoon column cover the whole season?

No. It adds July, August and September, so it misses June 15 to 30 and includes all of September.

Sources

  1. NOAA National Centers for Environmental Information. "NOAA 1991-2020 Climate Normals, Bisbee 1Wnw (monthly normals)." https://www.ncei.noaa.gov/access/services/data/v1?includeStationName=1&format=csv&stations=USC00020775&dataset=normals-monthly-1991-2020&dataTypes=MLY-TMAX-NORMAL,MLY-PRCP-NORMAL. Accessed October 21, 2026.
  2. NOAA National Centers for Environmental Information. "NOAA 1991-2020 Climate Normals, Bisbee 1Wnw (annual days at or above 100 F)." https://www.ncei.noaa.gov/access/services/data/v1?includeStationName=1&format=csv&stations=USC00020775&dataset=normals-annualseasonal-1991-2020&dataTypes=ANN-TMAX-AVGNDS-GRTH100. Accessed October 21, 2026.
  3. NOAA National Centers for Environmental Information. "NOAA 1991-2020 Climate Normals, Flagstaff Pulliam Airport (monthly normals)." https://www.ncei.noaa.gov/access/services/data/v1?includeStationName=1&format=csv&stations=USW00003103&dataset=normals-monthly-1991-2020&dataTypes=MLY-TMAX-NORMAL,MLY-PRCP-NORMAL. Accessed October 21, 2026.
  4. NOAA National Centers for Environmental Information. "NOAA 1991-2020 Climate Normals, Flagstaff Pulliam Airport (annual days at or above 100 F)." https://www.ncei.noaa.gov/access/services/data/v1?includeStationName=1&format=csv&stations=USW00003103&dataset=normals-annualseasonal-1991-2020&dataTypes=ANN-TMAX-AVGNDS-GRTH100. Accessed October 21, 2026.
  5. NOAA National Centers for Environmental Information. "NOAA 1991-2020 Climate Normals, Duncan (monthly normals)." https://www.ncei.noaa.gov/access/services/data/v1?includeStationName=1&format=csv&stations=USC00022754&dataset=normals-monthly-1991-2020&dataTypes=MLY-TMAX-NORMAL,MLY-PRCP-NORMAL. Accessed October 21, 2026.
  6. NOAA National Centers for Environmental Information. "NOAA 1991-2020 Climate Normals, Parker (monthly normals)." https://www.ncei.noaa.gov/access/services/data/v1?includeStationName=1&format=csv&stations=USC00026250&dataset=normals-monthly-1991-2020&dataTypes=MLY-TMAX-NORMAL,MLY-PRCP-NORMAL. Accessed October 21, 2026.
  7. NOAA National Centers for Environmental Information. "NOAA 1991-2020 Climate Normals, Parker (annual days at or above 100 F)." https://www.ncei.noaa.gov/access/services/data/v1?includeStationName=1&format=csv&stations=USC00026250&dataset=normals-annualseasonal-1991-2020&dataTypes=ANN-TMAX-AVGNDS-GRTH100. Accessed October 21, 2026.
  8. NOAA National Centers for Environmental Information. "NOAA 1991-2020 Climate Normals, Phoenix Sky Harbor International Airport (monthly normals)." https://www.ncei.noaa.gov/access/services/data/v1?includeStationName=1&format=csv&stations=USW00023183&dataset=normals-monthly-1991-2020&dataTypes=MLY-TMAX-NORMAL,MLY-PRCP-NORMAL. Accessed October 21, 2026.
  9. NOAA National Centers for Environmental Information. "NOAA 1991-2020 Climate Normals, Phoenix Sky Harbor International Airport (annual days at or above 100 F)." https://www.ncei.noaa.gov/access/services/data/v1?includeStationName=1&format=csv&stations=USW00023183&dataset=normals-annualseasonal-1991-2020&dataTypes=ANN-TMAX-AVGNDS-GRTH100. Accessed October 21, 2026.
  10. NOAA National Centers for Environmental Information. "NOAA 1991-2020 Climate Normals, Winslow Muni Airport (monthly normals)." https://www.ncei.noaa.gov/access/services/data/v1?includeStationName=1&format=csv&stations=USW00023194&dataset=normals-monthly-1991-2020&dataTypes=MLY-TMAX-NORMAL,MLY-PRCP-NORMAL. Accessed October 21, 2026.
  11. NOAA National Centers for Environmental Information. "NOAA 1991-2020 Climate Normals, Casa Grande Nm (monthly normals)." https://www.ncei.noaa.gov/access/services/data/v1?includeStationName=1&format=csv&stations=USC00021314&dataset=normals-monthly-1991-2020&dataTypes=MLY-TMAX-NORMAL,MLY-PRCP-NORMAL. Accessed October 21, 2026.
  12. NOAA National Centers for Environmental Information. "NOAA 1991-2020 Climate Normals, Casa Grande Nm (annual days at or above 100 F)." https://www.ncei.noaa.gov/access/services/data/v1?includeStationName=1&format=csv&stations=USC00021314&dataset=normals-annualseasonal-1991-2020&dataTypes=ANN-TMAX-AVGNDS-GRTH100. Accessed October 21, 2026.
  13. NOAA National Centers for Environmental Information. "NOAA 1991-2020 Climate Normals, Nogales 6 N (monthly normals)." https://www.ncei.noaa.gov/access/services/data/v1?includeStationName=1&format=csv&stations=USC00025924&dataset=normals-monthly-1991-2020&dataTypes=MLY-TMAX-NORMAL,MLY-PRCP-NORMAL. Accessed October 21, 2026.
  14. NOAA National Centers for Environmental Information. "NOAA 1991-2020 Climate Normals, Yuma Mcas (monthly normals)." https://www.ncei.noaa.gov/access/services/data/v1?includeStationName=1&format=csv&stations=USW00003145&dataset=normals-monthly-1991-2020&dataTypes=MLY-TMAX-NORMAL,MLY-PRCP-NORMAL. Accessed October 21, 2026.
  15. NOAA National Centers for Environmental Information. "NOAA 1991-2020 Climate Normals, Yuma Mcas (annual days at or above 100 F)." https://www.ncei.noaa.gov/access/services/data/v1?includeStationName=1&format=csv&stations=USW00003145&dataset=normals-annualseasonal-1991-2020&dataTypes=ANN-TMAX-AVGNDS-GRTH100. Accessed October 21, 2026.
  16. National Weather Service. "National Weather Service: extreme heat safety." https://www.weather.gov/safety/heat. Accessed October 21, 2026.
  17. National Weather Service. "National Weather Service: wind and dust storm safety." https://www.weather.gov/safety/wind-dust-storm. Accessed October 21, 2026.
  18. National Weather Service. "NWS Tucson monsoon safety (heat, thunderstorm and dust storm)." https://www.weather.gov/twc/monsoonsafety. Accessed October 21, 2026.
  19. National Weather Service. "NWS Phoenix heat safety." https://www.weather.gov/psr/heat. Accessed October 21, 2026.
  20. National Weather Service. "NWS Phoenix dust storm and monsoon safety." https://www.weather.gov/psr/MonsoonSafety. Accessed October 21, 2026.
  21. National Weather Service, Flagstaff. "Northern Arizona Monsoon Season." https://www.weather.gov/fgz/monsooninfo. Accessed October 21, 2026.
  22. National Weather Service, Phoenix. "2024 Monsoon Season Review." https://www.weather.gov/psr/2024MonsoonSeasonReview. Accessed October 21, 2026.