Heat lowers solar panel output
Three different temperatures get mixed together in searches about 115 degrees:
- Air temperature: what the thermometer reads, such as 115°F.
- Cell or surface temperature: how hot the panel itself runs, which is well above the air temperature on a sunny roof.
- Rated operating limit: the maximum a panel is built to tolerate, which is far higher than typical air temperatures.
Panels are rated at standard test conditions of 77°F (25°C) cell temperature. A hot roof means output falls below the nameplate number during peak afternoon hours.
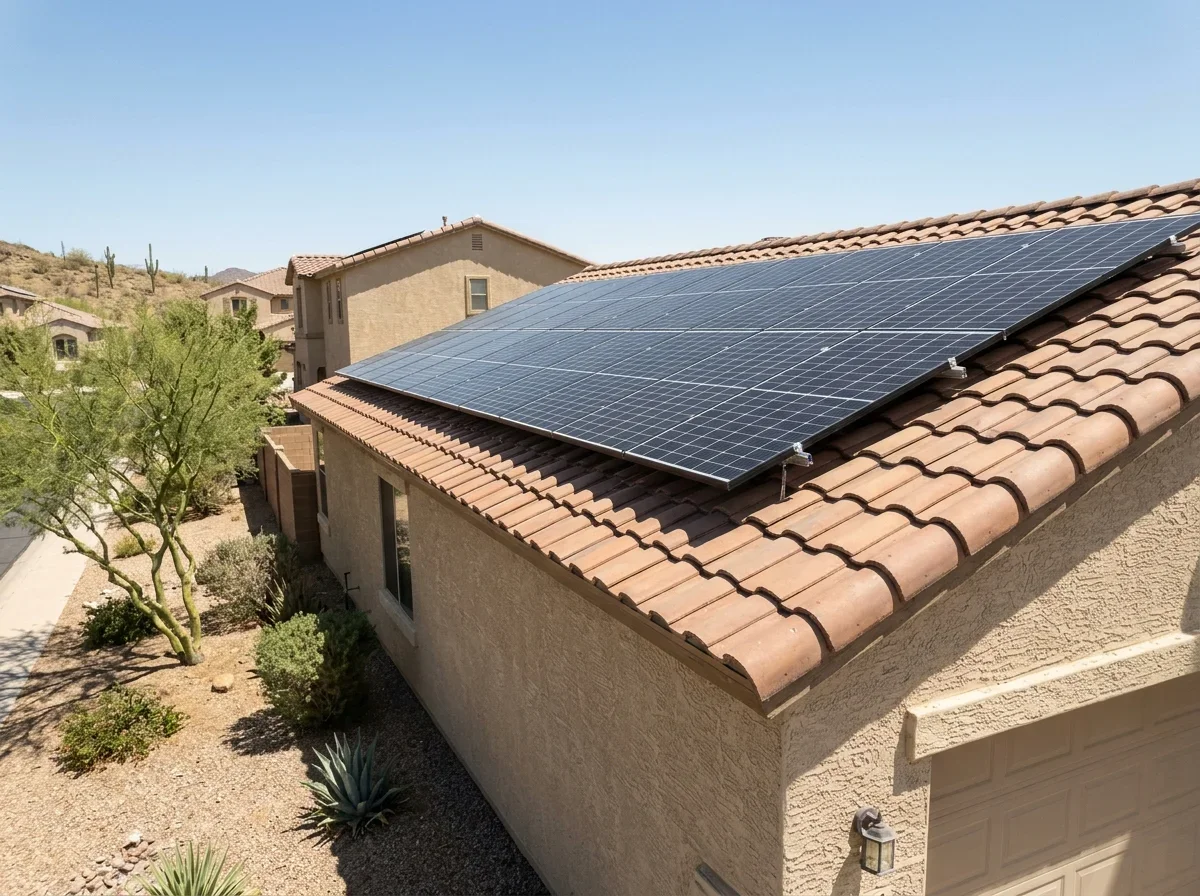
Production dips, but it does not stop.
The number to compare between panels is the temperature coefficient on the spec sheet. A less-negative value means less output lost for each degree of heat. No numbered source on this page supplies a coefficient range or a percentage loss for Arizona roofs, so use the figure printed on the specific panel's datasheet.
Ask your installer to model production with desert heat rather than the nameplate rating alone. Also ask how much air gap will sit between the array and the roof, since ventilation helps panels shed heat.
Decide
Which temperature are you reading?
What does the number describe?
If The thermometer reading, such as 115°F
then: Air temperature
If How hot the panel itself runs
then: Cell or surface temperature
If The most a panel is built to tolerate
then: Rated operating limit
Dirt and shading can make hot spots worse, so a clean array matters more in summer.
How many days a year reach 100 degrees, by county
The table shows the average number of days a year at or above 100°F. Figures are based on NOAA 1991-2020 climate normals from a single station in each county, not a county average.
| County | Station | Days at or above 100°F |
|---|---|---|
| Yuma | Yuma Mcas | 118.2[15] |
| Pinal | Casa Grande Nm | 115.6[12] |
| Maricopa | Phoenix Sky Harbor International Airport | 111.3[8] |
| La Paz | Parker | 126.3[7] |
| Pima | Tucson International Airport | 67.9[11] |
| Graham | Safford Ag Ctr | 45.6[5] |
| Greenlee | Duncan | 40.2[6] |
| Mohave | Kingman Mohave Co Airport | 32.4[9] |
| Gila | Globe #3 | 31.2[4] |
| Santa Cruz | Nogales 6 N | 22.3[13] |
| Navajo | Winslow Muni Airport | 12.3[10] |
| Apache | Saint Johns | 1.2[1] |
| Yavapai | Prescott | 1.2[14] |
| Cochise | Bisbee 1Wnw | 0.3[2] |
| Coconino | Flagstaff Pulliam Airport | 0.0[3] |
La Paz County is the hottest on these rows, and Coconino County is the coolest. Read the count as a rough measure of how often heat trims output, not as a verdict on whether solar is worthwhile.
126.3
days a year at or above 100°F at the Parker station in La Paz County
Duncan is 23 miles from the Greenlee County seat, and Winslow is 34 miles from the Navajo County seat. For more climate rows, see Arizona temperature and monsoon rain by county.
What heat means for panel lifespan
The heat-related dip in output on a hot afternoon is temporary, and it eases as the panel cools.
Long-term effects are a different question.
None of the numbered sources on this page covers degradation rates or warranty terms, so this page states no lifespan figure. Compare the warranty and degradation terms printed in each manufacturer's documentation instead.
Ask the installer to inspect for hotspots, loose connections and heat-exposed equipment after a long heat wave or a monsoon storm.
Choose a licensed installer
Heat performance belongs on your list of questions for an installer: temperature coefficient, air gap, and a production estimate built for desert conditions.
The solar hub covers the license classes that apply to solar work, and solar permit rules by city show where a permit applies.
Before you sign, check the contractor's Arizona license so you know the license on file matches the work.
Quick answers
Do solar panels stop working at 115 degrees?
No. Production dips on a hot roof during peak afternoon hours, but it does not stop.
Is 115°F the panel temperature?
Not usually. 115°F is air temperature, and the panel's cell temperature runs well above it on a sunny roof.
What number should I compare between panels?
The temperature coefficient on the datasheet. A less-negative value means less output lost for each degree of heat.
Sources
- NOAA National Centers for Environmental Information. "NOAA 1991-2020 Climate Normals, Saint Johns (annual days at or above 100 F)." https://www.ncei.noaa.gov/access/services/data/v1?includeStationName=1&format=csv&stations=USC00027435&dataset=normals-annualseasonal-1991-2020&dataTypes=ANN-TMAX-AVGNDS-GRTH100. Accessed October 21, 2026.
- NOAA National Centers for Environmental Information. "NOAA 1991-2020 Climate Normals, Bisbee 1Wnw (annual days at or above 100 F)." https://www.ncei.noaa.gov/access/services/data/v1?includeStationName=1&format=csv&stations=USC00020775&dataset=normals-annualseasonal-1991-2020&dataTypes=ANN-TMAX-AVGNDS-GRTH100. Accessed October 21, 2026.
- NOAA National Centers for Environmental Information. "NOAA 1991-2020 Climate Normals, Flagstaff Pulliam Airport (annual days at or above 100 F)." https://www.ncei.noaa.gov/access/services/data/v1?includeStationName=1&format=csv&stations=USW00003103&dataset=normals-annualseasonal-1991-2020&dataTypes=ANN-TMAX-AVGNDS-GRTH100. Accessed October 21, 2026.
- NOAA National Centers for Environmental Information. "NOAA 1991-2020 Climate Normals, Globe #3 (annual days at or above 100 F)." https://www.ncei.noaa.gov/access/services/data/v1?includeStationName=1&format=csv&stations=USC00023501&dataset=normals-annualseasonal-1991-2020&dataTypes=ANN-TMAX-AVGNDS-GRTH100. Accessed October 21, 2026.
- NOAA National Centers for Environmental Information. "NOAA 1991-2020 Climate Normals, Safford Ag Ctr (annual days at or above 100 F)." https://www.ncei.noaa.gov/access/services/data/v1?includeStationName=1&format=csv&stations=USC00027390&dataset=normals-annualseasonal-1991-2020&dataTypes=ANN-TMAX-AVGNDS-GRTH100. Accessed October 21, 2026.
- NOAA National Centers for Environmental Information. "NOAA 1991-2020 Climate Normals, Duncan (annual days at or above 100 F)." https://www.ncei.noaa.gov/access/services/data/v1?includeStationName=1&format=csv&stations=USC00022754&dataset=normals-annualseasonal-1991-2020&dataTypes=ANN-TMAX-AVGNDS-GRTH100. Accessed October 21, 2026.
- NOAA National Centers for Environmental Information. "NOAA 1991-2020 Climate Normals, Parker (annual days at or above 100 F)." https://www.ncei.noaa.gov/access/services/data/v1?includeStationName=1&format=csv&stations=USC00026250&dataset=normals-annualseasonal-1991-2020&dataTypes=ANN-TMAX-AVGNDS-GRTH100. Accessed October 21, 2026.
- NOAA National Centers for Environmental Information. "NOAA 1991-2020 Climate Normals, Phoenix Sky Harbor International Airport (annual days at or above 100 F)." https://www.ncei.noaa.gov/access/services/data/v1?includeStationName=1&format=csv&stations=USW00023183&dataset=normals-annualseasonal-1991-2020&dataTypes=ANN-TMAX-AVGNDS-GRTH100. Accessed October 21, 2026.
- NOAA National Centers for Environmental Information. "NOAA 1991-2020 Climate Normals, Kingman Mohave Co Airport (annual days at or above 100 F)." https://www.ncei.noaa.gov/access/services/data/v1?includeStationName=1&format=csv&stations=USW00093167&dataset=normals-annualseasonal-1991-2020&dataTypes=ANN-TMAX-AVGNDS-GRTH100. Accessed October 21, 2026.
- NOAA National Centers for Environmental Information. "NOAA 1991-2020 Climate Normals, Winslow Muni Airport (annual days at or above 100 F)." https://www.ncei.noaa.gov/access/services/data/v1?includeStationName=1&format=csv&stations=USW00023194&dataset=normals-annualseasonal-1991-2020&dataTypes=ANN-TMAX-AVGNDS-GRTH100. Accessed October 21, 2026.
- NOAA National Centers for Environmental Information. "NOAA 1991-2020 Climate Normals, Tucson International Airport (annual days at or above 100 F)." https://www.ncei.noaa.gov/access/services/data/v1?includeStationName=1&format=csv&stations=USW00023160&dataset=normals-annualseasonal-1991-2020&dataTypes=ANN-TMAX-AVGNDS-GRTH100. Accessed October 21, 2026.
- NOAA National Centers for Environmental Information. "NOAA 1991-2020 Climate Normals, Casa Grande Nm (annual days at or above 100 F)." https://www.ncei.noaa.gov/access/services/data/v1?includeStationName=1&format=csv&stations=USC00021314&dataset=normals-annualseasonal-1991-2020&dataTypes=ANN-TMAX-AVGNDS-GRTH100. Accessed October 21, 2026.
- NOAA National Centers for Environmental Information. "NOAA 1991-2020 Climate Normals, Nogales 6 N (annual days at or above 100 F)." https://www.ncei.noaa.gov/access/services/data/v1?includeStationName=1&format=csv&stations=USC00025924&dataset=normals-annualseasonal-1991-2020&dataTypes=ANN-TMAX-AVGNDS-GRTH100. Accessed October 21, 2026.
- NOAA National Centers for Environmental Information. "NOAA 1991-2020 Climate Normals, Prescott (annual days at or above 100 F)." https://www.ncei.noaa.gov/access/services/data/v1?includeStationName=1&format=csv&stations=USC00026796&dataset=normals-annualseasonal-1991-2020&dataTypes=ANN-TMAX-AVGNDS-GRTH100. Accessed October 21, 2026.
- NOAA National Centers for Environmental Information. "NOAA 1991-2020 Climate Normals, Yuma Mcas (annual days at or above 100 F)." https://www.ncei.noaa.gov/access/services/data/v1?includeStationName=1&format=csv&stations=USW00003145&dataset=normals-annualseasonal-1991-2020&dataTypes=ANN-TMAX-AVGNDS-GRTH100. Accessed October 21, 2026.